


image analysis
Digital cameras are extremely powerful tools for recording spatial information across different wavelengths, but for testing biological hypotheses we generally need to know what a scene will look like to an animal, not our camera. To do this we use a number of image processing techniques and camera calibration procedures. We have released a software toolbox that enables easy objective image analysis. The toolbox can be downloaded from here.
Linearisation
First, we need linearised images, where a pixel value twice as high as another in a given channel corresponds to twice the irradiance falling on the sensor. This is not normally the case with digital photographs, as cameras can capture a much larger working range of intensities than print or monitors can recreate.
Normalisation
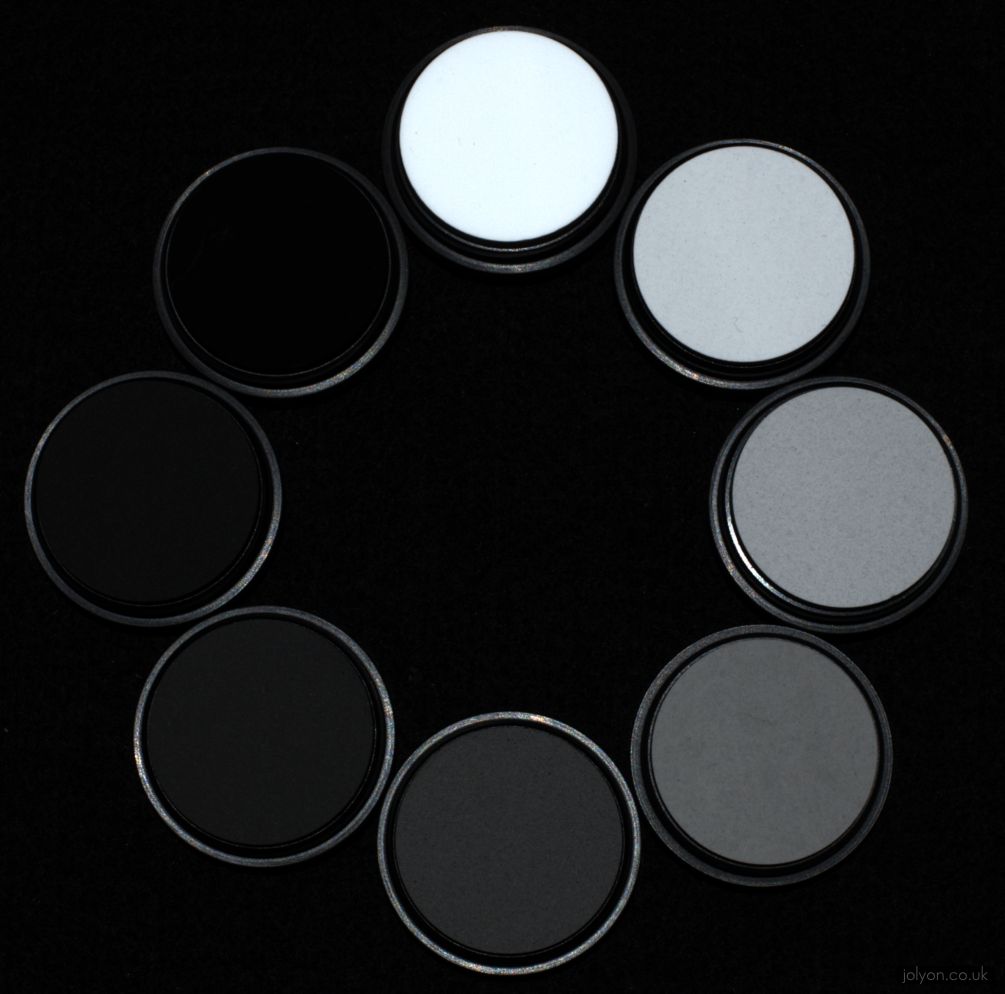
Lighting conditions change continually – e.g. with atmospheric conditions or time of day – but we need to be able to compare one photo to another taken under different conditions. To do this we use a diffuse (very matt surface) grey standard in the photo to measure the colour of the grey as perceived by the camera. The camera colour channels are then linearly re-levelled so that the grey standard has an equal value across all channels. This is similar to our eyes adapting to ambient lighting conditions (e.g. a tungsten bulb will look very orange when you walk from a flourescent-tube lit room, but that orange-ness will fade over a few seconds/minutes and white things will look white again).
Cone-mapping
The colour receptors (cones) of different animals are sensitive to different wavelengths, meaning they see the world in completely different ways. Most humans can see red, green and blue (trichromats), while most other mammals can’t see the difference between red and green (dichromats), and our relatively big eyes block out much of the ultraviolet light, meaning smaller mammals are likely to see further into UV than us. Birds see in four colours (tetrochromats) broadly split into those that see in UV or deep violet, and their cones are further tuned by oil droplets that act like tiny filters in their retinae. In order to convert photographs from digital camera vision to animal vision we need to know the sensitivity of our camera and the animal’s cones to different wavelengths of light. Then we take a database of thousands of natural colour spectra and generate a model that maps from the colours of the camera to the colours of our animal.
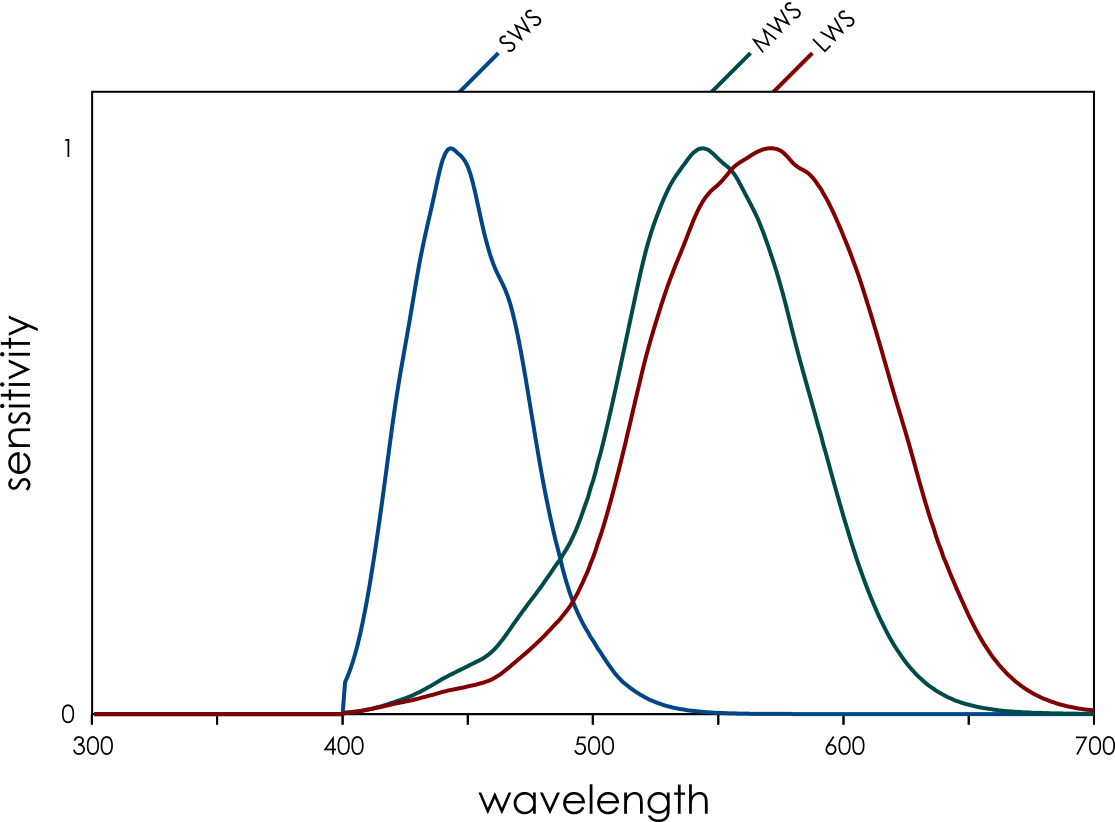 We humans evolved from dichromatic mammals, with our “yellow” sensor splitting into a longer (red) and shorter (green) sensor. This is really handy for seeing red things against a green background, and foraging for fruit and new shoots on plants is thought to have been a driver of our trichromatic vision. But our red and green sensitivities (left) are quite overlapping.
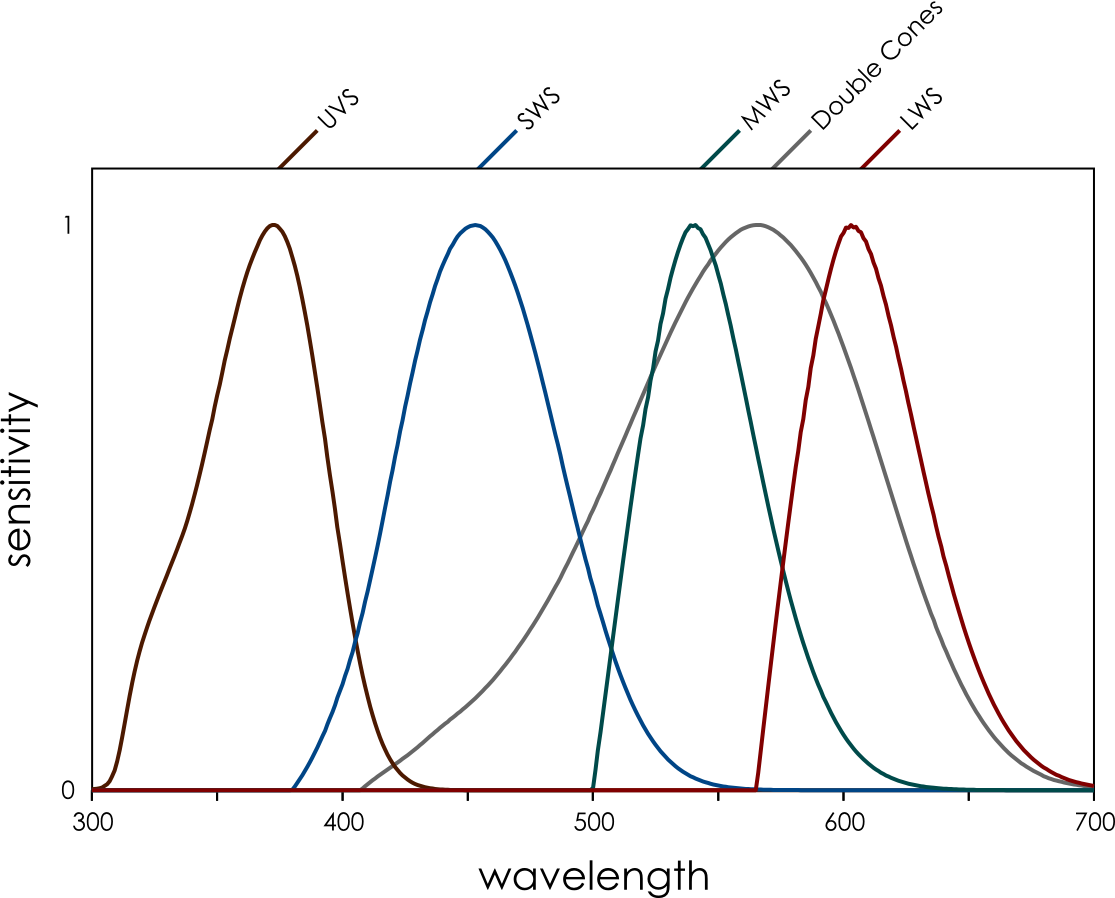 Bluetits have nicely separated spectral sensitivities thanks to the oil droplets in their eyes that filter out certain colours. They can also see in ultraviolet, so if we want to see what the world looks like to a bluetit we need a UV-sensitive camera.
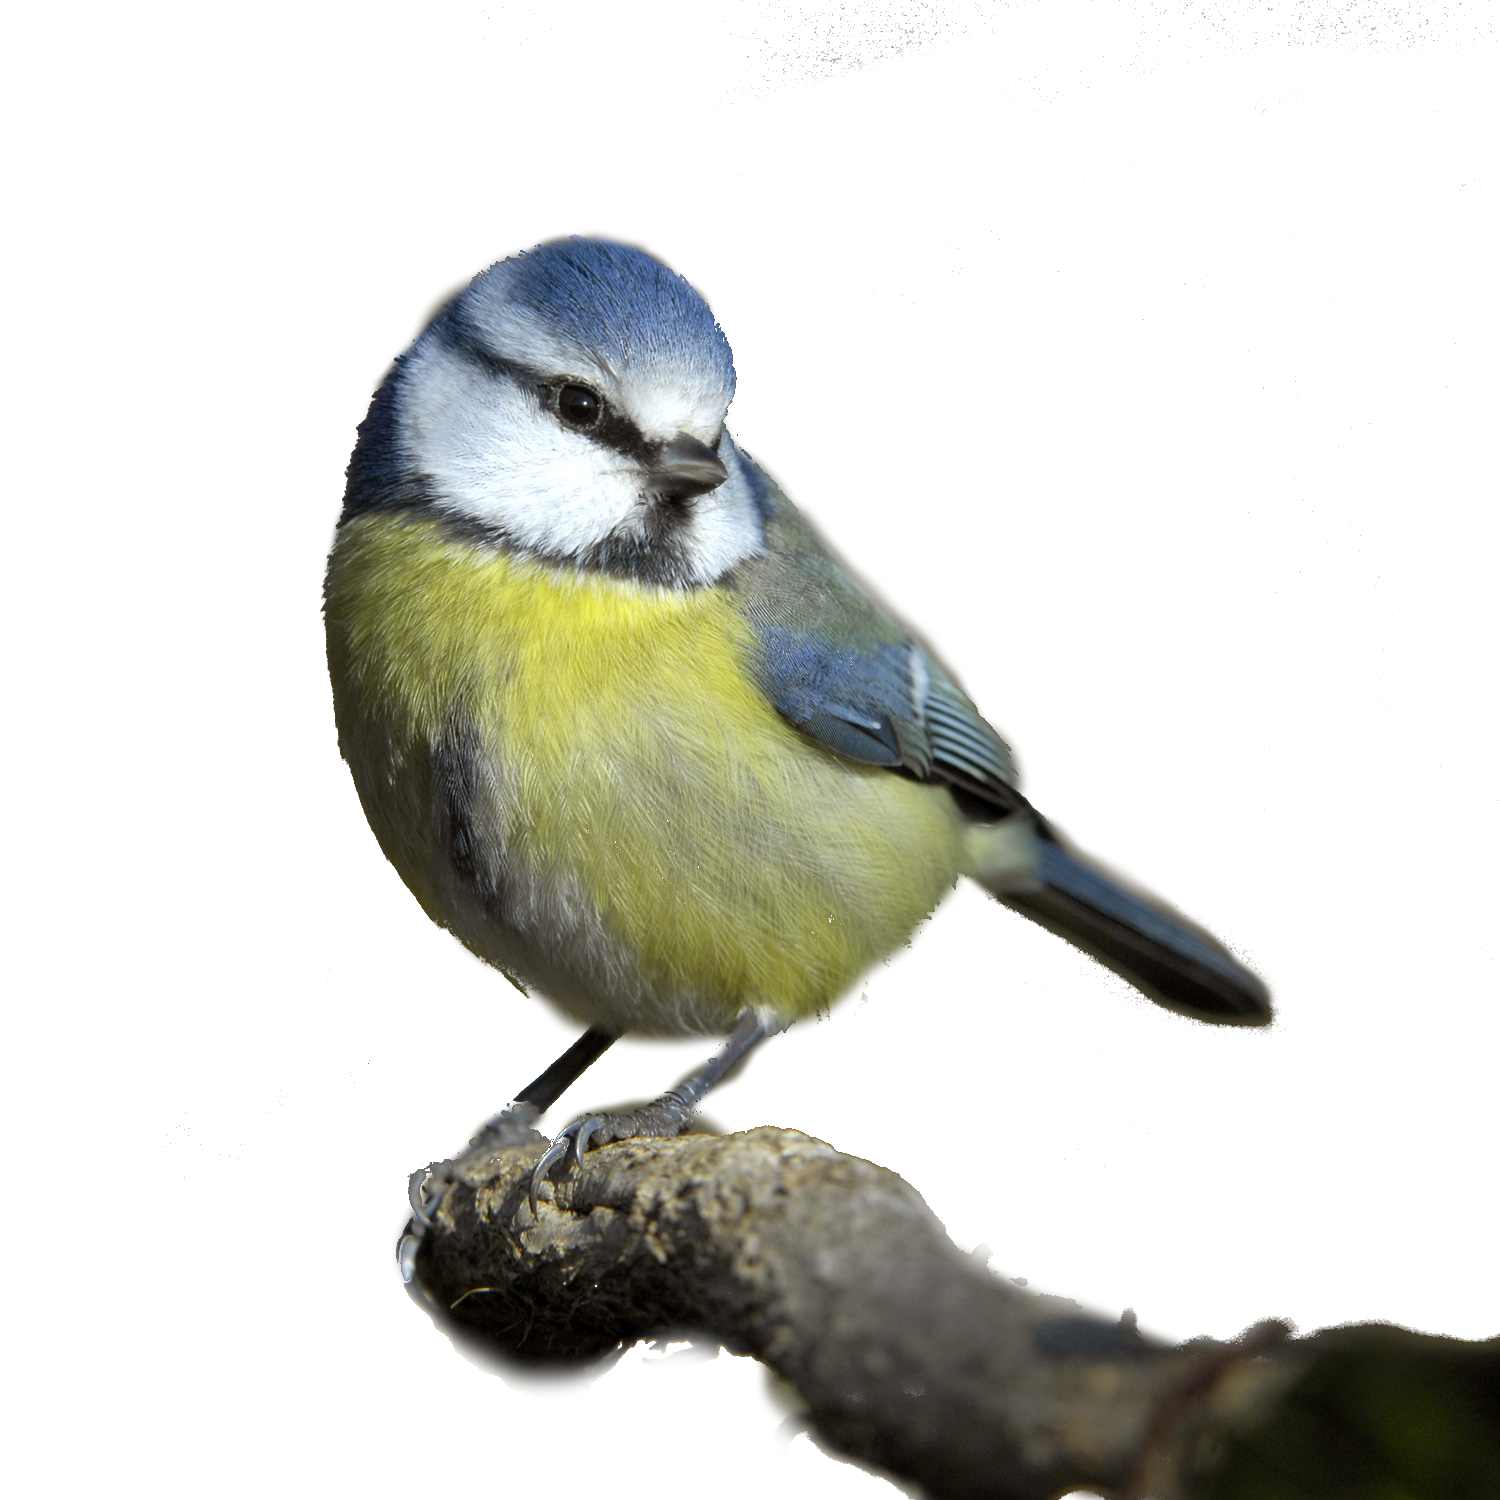
Image Processing
Once we’ve got animal “cone-catch” images there are loads of different analyses we can do. These broadly fall into a few different categories: luminance and contrast, pattern, edge disruption, and colour.
What are the methods/software for calibrating a camera or finding out the spectral response? Once you’ve acquired images using a monochromatic, how do you “extract” spectral sensitivity?
You need to shine monochromated light onto a white diffuse reflectance standard (ideally sintered PTFE). You photograph this, and also measure the radiance of light using a spectroradiometer. You take photos at e.g. 5nm intervals across the entire range the camera is sensitive to (it’s easiest to use a fixed shutter-speed, aperture and ISO). Then you compare the linear RAW pixel values in each image to the known radiance at each wavelength to calculate the camera’s sensitivity.