Measuring Disruptive Camouflage

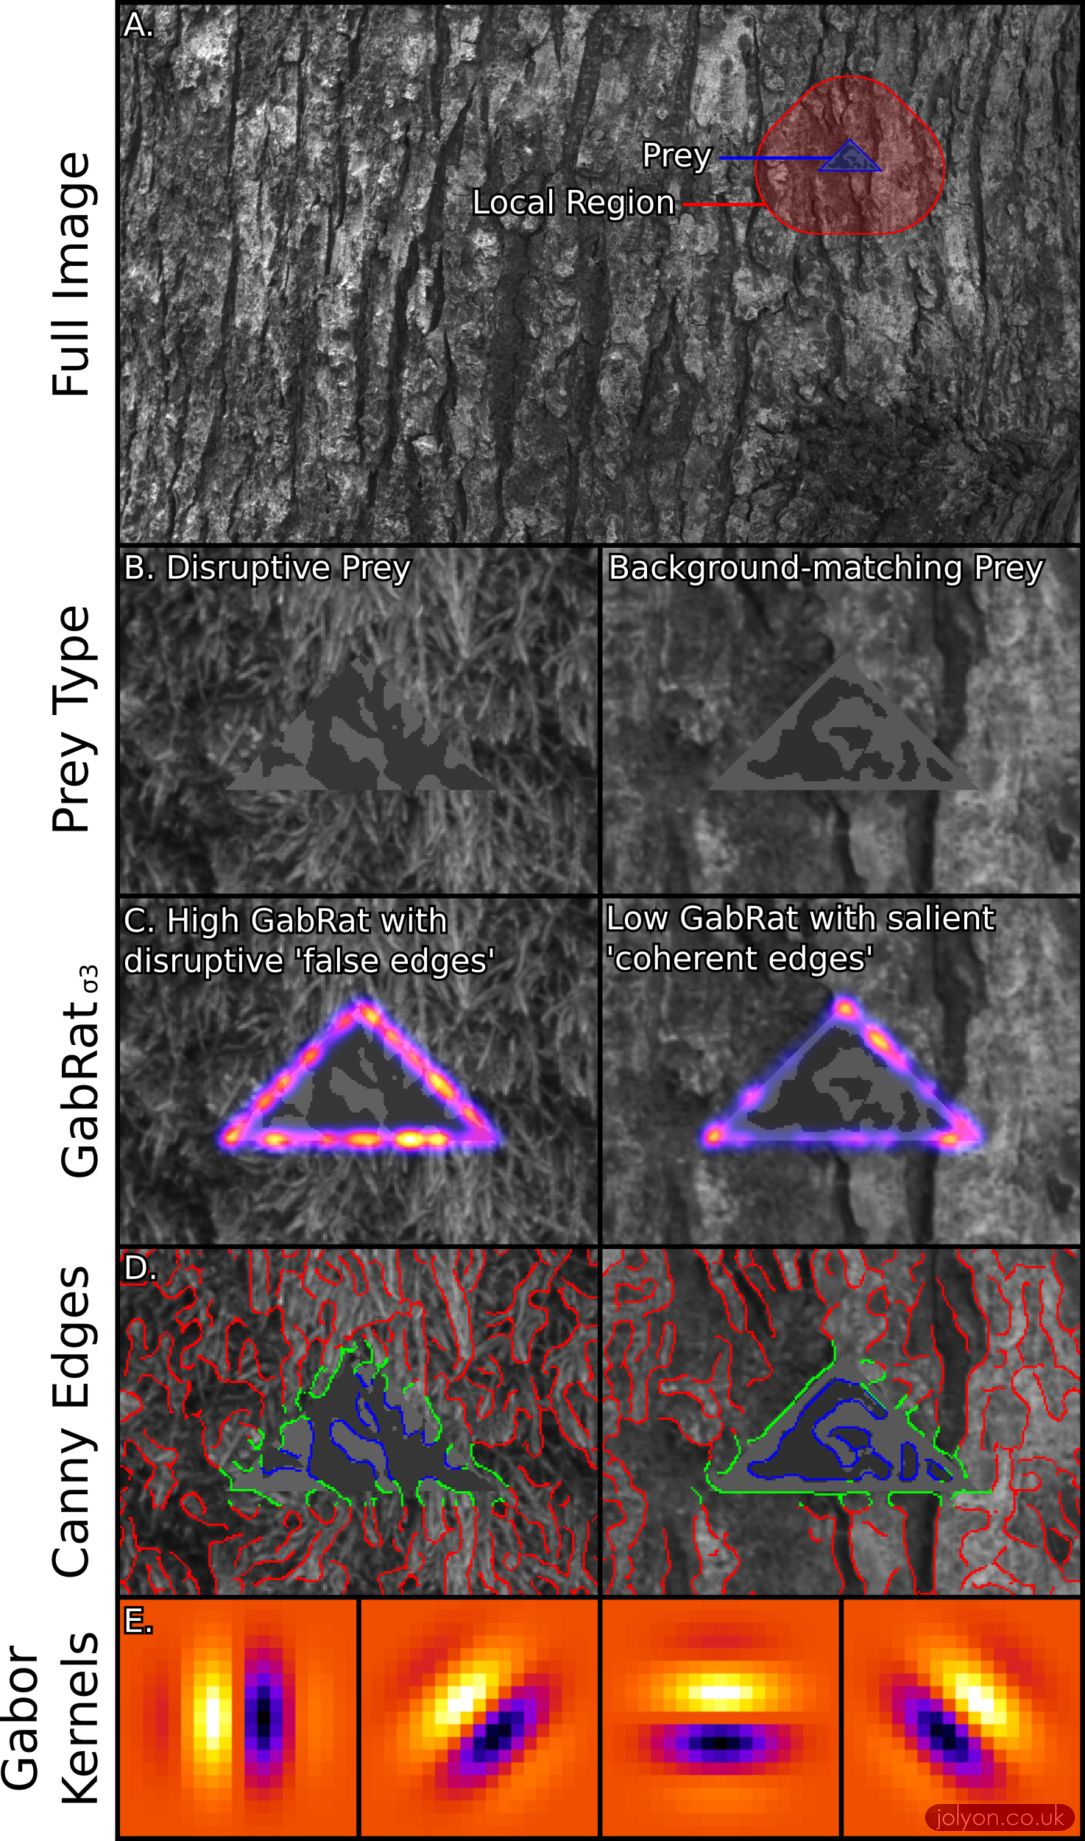
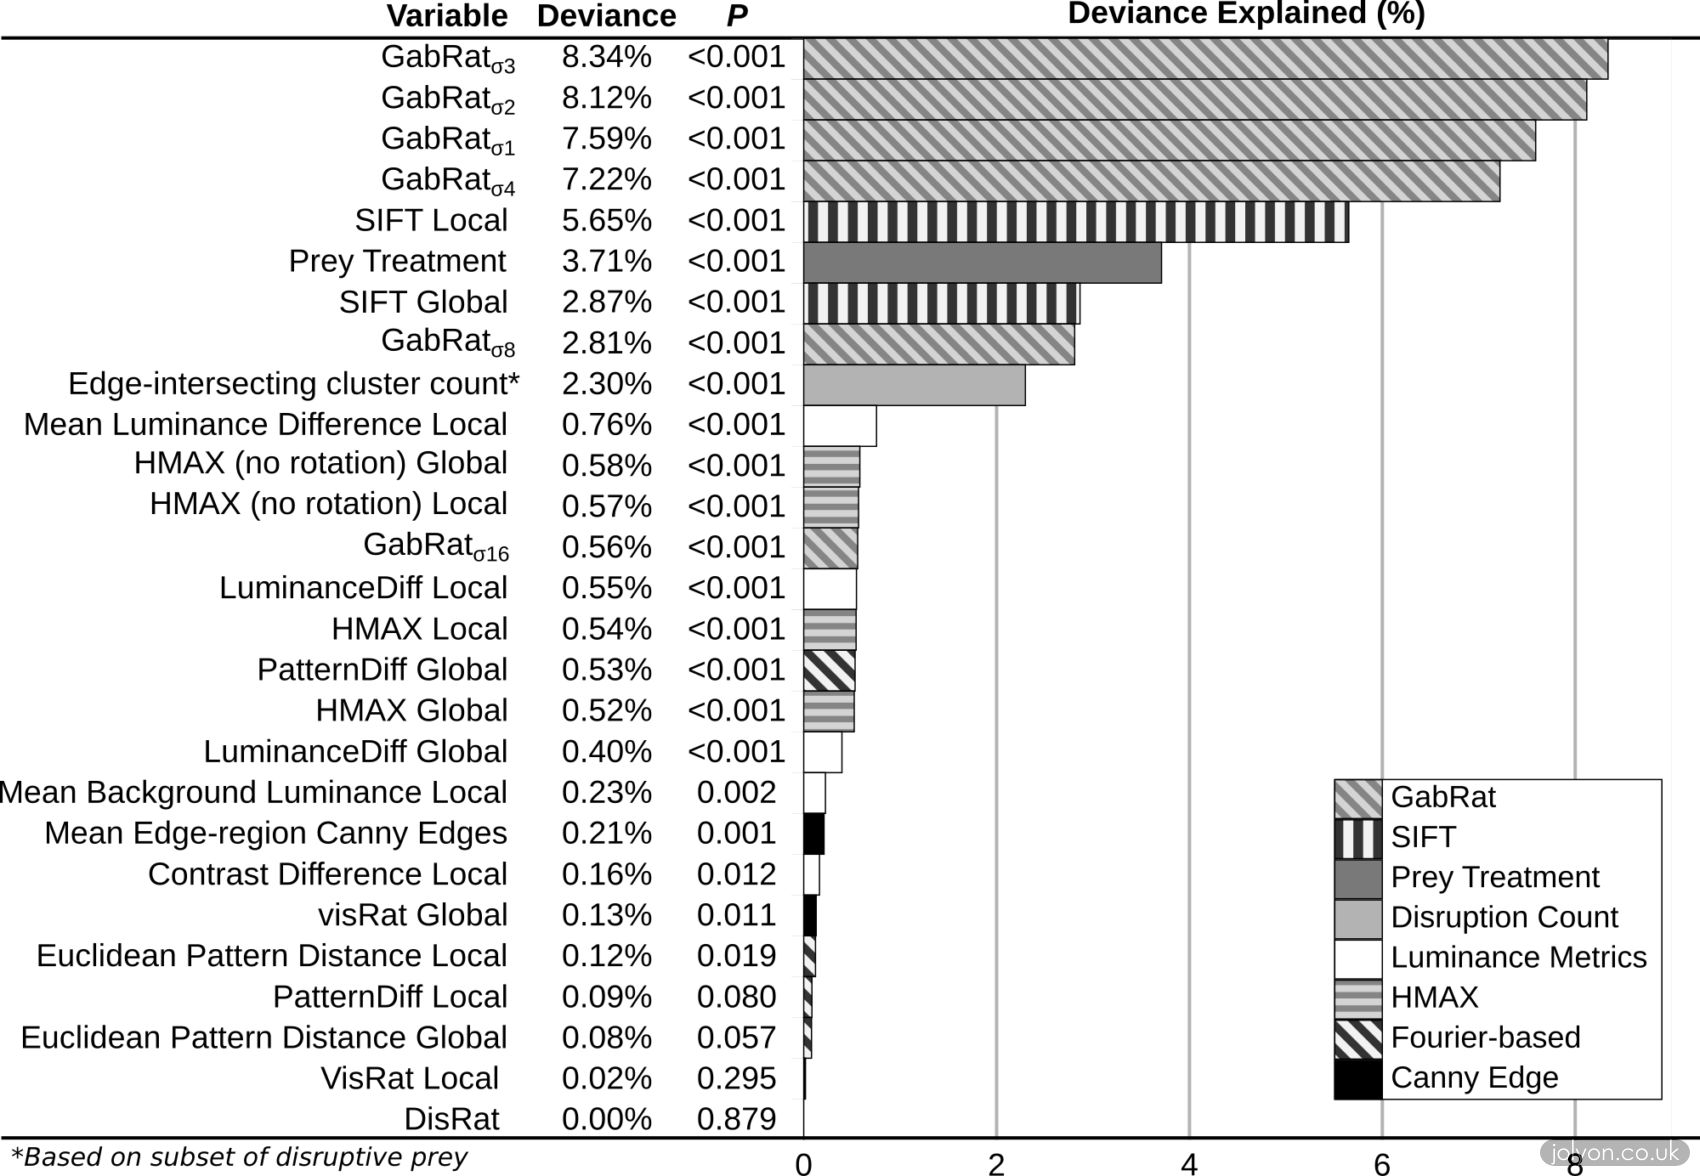
Estimating how visible something is against its background is essential in many studies of animal colouration, signalling and camouflage. There are many models and methods used to estimate a target’s visibility; some of these methods use very simple luminance or pattern measures, while others use more complex feature detection algorithms. In our new paper just out, we tested how well a range of methods predicted human capture times for artificially generated camouflaged moths, similar to those in this online game. Something known to make targets easier to find is the visibility of their outlines, and high contrast ‘disruptive’ patterns are thought to break up edges and make the target’s outline more difficult to see. We devised a new method for measuring edge disruption based on the intensity and direction of perceived edges versus actual edges around the target’s outline. This new measure outperformed all other methods even though it measured a smaller region of the image than any other measure, making it highly computationally efficient.


gabrat-and-canny-figure
Prey were artificially generated and presented to people against a random selection of tree-bark backgrounds (A). Prey were either generated as ‘Disruptive’ where the pattern elements intersect the target edges or ‘Background-matching’ where the patterns did not touch the edges (B). Our new measure of disruption used Gabor filters (E) to measure the actual angle of the prey around its edges, and then also the intensity of the perceived edge at ninety degrees to this angle (C), with GabRat being the ratio of these two measures averaged around the prey’s edge. Previous methods for measuring edge disruption were far less effective (e.g. those using the location of detected edges without considering their angle, D).
deviance-table-and-graph-bw-redone
GabRat was far better at predicting human capture times than other metrics, as shown by the higher levels of model deviance explained by GabRat compared to other measures. GabRat was also most effective with a sigma value of 3, which matches the peak of human spatial frequency sensitivity.

Recent Posts

Be First to Comment

Leave a Reply

Your email address will not be published.

This site uses Akismet to reduce spam. Learn how your comment data is processed.